Coffee Price Forecast: Expert Analysis and Market Predictions
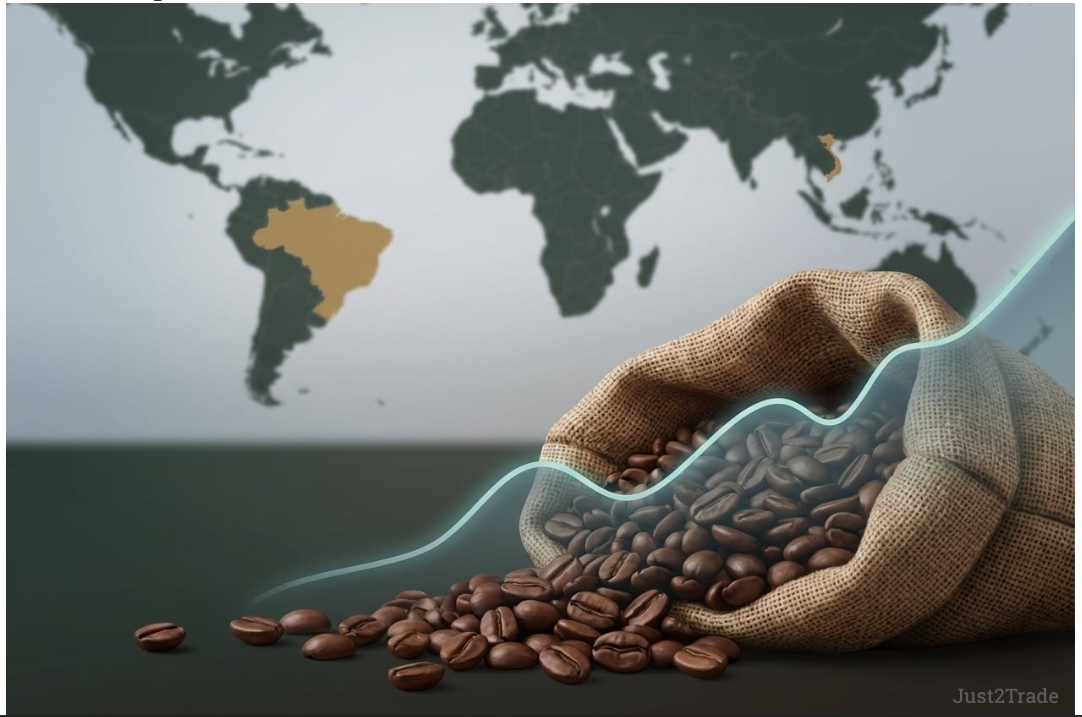
Coffee prices reached unprecedented levels in 2025, with Arabica (ICE Coffee C) hitting a record high of $4.3795 per pound in October 2025. Climate disruptions in Brazil and Vietnam, supply chain constraints, and tight global inventories drove this surge. Since then, the market has stayed extremely volatile rather than settling: Arabica fell 37.8% to a 2026 low of $2.3885/lb on June 9, 2026, then surged roughly 49.5% to $3.57/lb by July 6 - the largest weekly gain since 2000 - eased to $3.20-3.40/lb by mid-July, spiked again to around $3.42/lb in mid-to-late August as ICE certified Arabica stocks fell near a 26-year low, and has since settled near $3.08 per pound as of September 1, 2026.
Brazil's worst drought in history and Vietnam's 20 percent production drop in 2023/24 created severe supply deficits. These countries produce nearly 50 percent of global supply. Brazil experienced 110,000 wildfires across coffee regions while Vietnam faced prolonged drought, pushing prices to 47-year highs.
A 50% U.S. tariff on Brazilian coffee imports, introduced in 2025-2026, is adding cost pressure independent of weather. Brazil's national food agency Conab has said the tariff is pushing prices higher and underscores the difficulty of replacing Brazilian supply. Uncertainty over Brazil's 2026 harvest quality following erratic June rainfall, and a drop in ICE certified Arabica stocks to their lowest level since 2024, have added further support to prices through August.
State of the Coffee Market in 2026
The ICO Composite Indicator averaged $3.30 per pound in November 2025. Arabica went on to hit an all-time record of $4.3795/lb in October 2025, then declined sharply through H1 2026 - falling 37.8% to a low of $2.3885/lb on June 9, 2026 - before rallying hard to around $3.20-3.40/lb by mid-July as Brazilian harvest and quality concerns resurfaced, alongside the new U.S. tariff on Brazilian coffee. A further spike to roughly $3.42/lb followed in mid-to-late August as ICE certified Arabica stocks fell near a 26-year low, before prices eased to around $3.08/lb by September 1. This has proven a highly volatile year rather than a steady moderation. The USDA's record global production forecast of 178.7 million bags for 2025/26 remains a useful supply-side data point, though it clearly has not been enough on its own to stop the repeated 2026 price spikes.
2026 Monthly Coffee Price Forecast (Arabica, US cents/lb):
Month Opening Price Closing Price Min Price Max Price Change
July 2026 319.65 315.48 306.33 328.92 −1.31%
August 2026 315.20 306.85 297.64 324.65 −2.65%
September 2026 306.57 298.50 291.93 313.31 −2.63%
October 2026 298.22 289.87 279.44 308.96 −2.80%
November 2026 289.59 281.52 275.61 295.67 −2.79%
December 2026 281.24 272.89 264.43 289.96 −2.97%
Price Trends for Arabica vs. Robusta
Arabica experienced more dramatic swings due to Brazil's production shortfalls, with Colombian Milds averaging $4.05 per pound in March 2025. Robusta showed greater resilience despite Vietnam's challenges but still doubled year-over-year. The traditional price differential narrowed as global supply constraints affected both varieties.
Arabica vs. Robusta Price Comparison 2026:
Factor Arabica Robusta
Current Price (Dec 2025) $2.80/lb $1.73/lb
Current Price (Sep 2026) $3.08/lb $1.64–$1.67/lb*
2026 Trading Range (YTD) $2.39 – $3.57/lb $1.61 – $2.26/lb*
Primary Risk Brazil frost / drought / delayed harvest quality concerns Vietnam weather
Market Share 60% global 40% global
Volatility Higher Moderate
US Coffee C Futures, price chart (Investing.com, September 1, 2026)
As of September 1, 2026, Investing.com's Monthly technical summary for US Coffee C Futures reads Neutral, with Moving Averages Strong Buy (10 buy / 2 sell) and Technical Indicators Sell (3 buy / 5 sell).
Key Factors Driving Coffee Prices in Today's Market
Global consumption growth outpaced production, with ending inventories falling to 21.8 million bags—the tightest in years. Research indicates coffee-growing regions could shrink by 50 percent by 2050, creating long-term supply pressure.
Top Factors Influencing Coffee Prices:
Weather volatility: El Niño conditions exacerbated droughts in Brazil and Vietnam
Labor challenges: Aging farmer populations reducing production capacity
Input cost inflation: Fertilizer and energy prices up 25-30 percent
Geopolitical factors: a 50% U.S. tariff on Brazilian coffee imports, in effect since 2025-2026, is a direct, quantifiable cost factor rather than a general risk, and Conab has directly linked it to recent price strength
Inventory tightness: ICE certified Arabica stocks fell to their lowest level since 2024 in August 2026, a fresh supply-side pressure point independent of the tariff or weather
Coffee Price Prediction 2027-2030
The World Bank's projection of Arabica declining 13 percent in 2026 has not played out as a smooth decline: the actual path included a 37.8% drop to a June 2026 low, a ~50% spike into July, and a further spike to $3.42 in August before settling near $3.08 by September 1. Whether 2026 ends the year down 13% depends heavily on price action in Q4; the actual January-September 2026 trading range so far (roughly $2.39-$3.57/lb) is the more relevant reference point than a single unqualified percentage.
Note on units and internal consistency: this annual table states Arabica in whole dollars per pound, while the monthly tables later in this article (below, and in the 2028-2030 section) are in US cents per pound — the standard ICE Coffee C quotation unit. Converting the monthly tables to dollars shows them projecting a continued climb from roughly $3.27/lb in January 2027 to nearly $5.00/lb by December 2030, which is the opposite direction from this annual table's $1.80-2.73 declining range for the same years. The two appear to reflect different underlying models rather than a single reconciled forecast; readers should treat them as alternative scenarios, not as consistent with one another.
Annual Coffee Price Forecast 2027-2030:
Year Arabica ($/lb) Robusta ($/lb) Confidence Level
2027 1.80 – 2.73 1.65 – 1.85 40%
2028 1.75 – 2.14 1.60 – 1.80 30%
2029 1.76 – 2.05 1.55 – 1.75 25%
2030 1.91 – 2.24 1.60 – 1.80 20%
Short-term Market Outlook 2027
Brazil's 2026/27 crop is projected at 71 million bags—a 10.5 percent increase. Vietnam's recovery to 31 million bags should ease Robusta tightness. Support levels exist around $2.50 per pound for Arabica and $1.65 for Robusta.
Key Market Indicators to Track in 2027:
Brazilian rainfall patterns during April-September 2026 flowering and fruit development stages
Vietnam harvest progress from October 2026 through March 2027 for Robusta supply assessment
Certified stock levels at ICE Futures US and London ICE exchanges indicating market tightness
Currency movements in Brazilian real and Vietnamese dong affecting export competitiveness
Global inventory reports from ICO showing consumer stock drawdown rates
2027 Monthly Coffee Price Forecast (Arabica, US cents/lb):
Month Opening Price Closing Price Min Price Max Price Change, %
January 2027 326.9 330.59 326.9 330.71 1.12%
February 2027 331.48 333.28 331.48 333.73 0.54%
March 2027 333.65 337.64 333.65 337.64 1.18%
April 2027 337.68 344.79 337.52 345.38 2.06%
May 2027 344.69 343.1 342.76 344.98 -0.46%
June 2027 343.54 342.65 342.2 343.73 -0.26%
July 2027 342.48 346.98 342.12 347.27 1.3%
August 2027 347.47 359.13 347.47 359.13 3.25%
September 2027 359.61 357.91 357.45 361.01 -0.48%
October 2027 357.64 360.17 357.64 361.56 0.7%
November 2027 360.11 367.55 360.11 367.55 2.02%
December 2027 367.7 369.93 367.21 370.27 0.6%
Long-term Coffee Forecast 2028-2030
Prices should stabilize at structurally higher levels as climate adaptation investments improve resilience. New plantations—particularly Robusta in Brazil's warmer regions—will increase supply but require 3-4 years to reach full production.
Month Opening Price Closing Price Min Price Max Price Change, %
January 2028 370.28 374.3 370.28 374.3 1.07%
February 2028 374.95 377.16 374.95 377.16 0.59%
March 2028 377.35 380.37 377.02 380.55 0.79%
April 2028 381.24 387.95 381.24 388.47 1.73%
May 2028 387.94 386.74 385.93 388.25 -0.31%
June 2028 386.6 385.23 385.23 386.89 -0.36%
July 2028 385.47 390.46 385.47 390.46 1.28%
August 2028 390.98 402.47 390.88 402.47 2.86%
September 2028 402.45 400.63 400.63 404.09 -0.45%
October 2028 401.2 403.65 401.2 404.71 0.61%
November 2028 403.72 410.64 403.22 410.74 1.69%
December 2028 410.31 412.93 410.31 413.24 0.64%
Month Opening Price Closing Price Min Price Max Price Change, %
January 2029 413.33 418.11 413.33 418.11 1.14%
February 2029 418.17 420.35 418.01 420.35 0.52%
March 2029 420.28 423.25 420 423.48 0.7%
April 2029 424.04 431.16 424.04 431.52 1.65%
May 2029 431.49 429.7 429.08 431.49 -0.42%
June 2029 429.34 428.36 428.36 430.03 -0.23%
July 2029 428.53 433.96 428.53 433.96 1.25%
August 2029 434.16 445.12 433.85 445.12 2.46%
September 2029 446.22 443.67 443.67 447.09 -0.57%
October 2029 444.11 446.88 444.11 447.81 0.62%
November 2029 446.68 453.37 446.3 453.76 1.48%
December 2029 453.61 456.37 453.55 456.37 0.6%
Month Opening Price Closing Price Min Price Max Price Change, %
January 2030 456.85 461.01 456.55 461.01 0.9%
February 2030 460.86 463.29 460.86 463.37 0.52%
March 2030 463 466.17 463 466.44 0.68%
April 2030 466.87 474.7 466.87 474.7 1.65%
May 2030 474.73 472.44 472.19 474.73 -0.48%
June 2030 472.64 471.51 471.51 473.16 -0.24%
July 2030 471.63 477.14 471.63 477.14 1.16%
August 2030 477.09 487.73 476.83 487.73 2.18%
September 2030 489 487.07 486.77 490.27 -0.4%
October 2030 487.6 489.85 487.6 490.87 0.46%
November 2030 489.43 496.41 489.43 496.73 1.41%
December 2030 496.72 499.88 496.69 499.88 0.63%
Regional Analysis: How Different Coffee-Producing Regions Will Fare
Regional dynamics determine whether global supply can meet 2-3 percent annual demand growth. The USDA forecasts 2025/26 production at 178.7 million bags—up 4.3 million—with Ethiopia, Vietnam, and Indonesia gains offsetting Brazil and Colombia declines.
South American Production Forecast
Brazil's 2024/25 production fell to 64.7 million bags due to drought and heat, recovering to 65 million in 2025/26. Colombia forecasts 12.5 million bags for 2025/26—down 5.3 percent as excessive rainfall disrupted flowering.
South American Coffee Origin Outlook Comparison:
Brazil: Dominant global supplier with 65 million bags forecast for 2025/26, faces highest climate risk from drought and frost, investing heavily in Robusta expansion in warmer regions, biennial cycle means alternating high/low production years
Colombia: Premium Arabica specialist with 12.5 million bags projected, tree renewal programs supporting gradual recovery, excessive rainfall main risk factor, strong specialty market positioning maintains price premiums
Peru: Smaller producer at approximately 4 million bags, organic and fair-trade focus, mountainous terrain provides climate advantages, limited infrastructure constrains growth potential
Ecuador: Minor producer with 500,000 bags annually, Robusta and Arabica mix, export growth potential exists, climate relatively stable compared to larger neighbors
Asian and African Market Dynamics
Vietnam recovers to 31 million bags in 2025/26—a 6.9 percent increase. Ethiopia reaches record 11.6 million bags through higher-yielding varieties. Indonesia forecasts 11.3 million bags with gains primarily in Robusta.
Emerging Coffee Origins Ranked by Market Impact Potential:
Ethiopia: Record production of 11.6 million bags with higher-yielding varieties, specialty Arabica commanding premium prices, accounts for 33.8% of national export earnings, tree replacement program driving sustained growth
Uganda: Rapidly expanding producer reaching 7 million bags, both Robusta and Arabica production, aggressive plantation expansion in southwestern regions, competitive pricing attracting buyers
Indonesia: 11.3 million bags with Robusta dominance, Sumatra and Java prime growing areas, improving quality standards, favorable weather supporting yield increases
India: Approximately 6 million bags with monsoon-dependent yields, both Arabica and Robusta production, domestic consumption growing rapidly, export potential constrained by internal demand
Honduras: Central America's largest producer at 8 million bags, quality improvements attracting specialty buyers, climate risks from hurricanes, competitive labor costs
Asian and African Coffee Production Comparison:
Country Annual Production Primary Type 2025/26 Forecast Export Volume Key Advantage
Vietnam 31 million bags Robusta (95%) +6.9% growth 24.6 million bags Scale, efficiency, climate resilience
Ethiopia 11.6 million bags Arabica Record high 7.8 million bags Quality, specialty premium, tree renewal
Indonesia 11.3 million bags Robusta (85%) +5% growth 8.5 million bags Geographic diversity, improving quality
Uganda 7 million bags Robusta (80%) +8% growth 6 million bags Low costs, rapid expansion
India 6 million bags Mixed -3% decline 3.7 million bags Domestic market, monsoon patterns
Tanzania 1.2 million bags Arabica Stable 950,000 bags Quality potential, infrastructure challenges
Strategies for Coffee Businesses to Navigate Price Volatility
Risk management through hedging and diversification is essential. Balanced approaches combine physical inventory management with financial instruments. Businesses maintaining diversified origin portfolios weathered recent volatility better than those concentrated in single regions.
Practical Strategies:
Forward contracting: Lock in 40-60 percent of annual requirements 6-12 months ahead
Options strategies: Use puts and calls to establish price floors and ceilings
Inventory optimization: Maintain 2-3 months coverage while avoiding excessive carrying costs
Producer partnerships: Direct sourcing reduces intermediary costs and improves supply reliability
Risk Management Strategies Comparison:
Strategy Best For Advantages Disadvantages
Futures Hedging Large importers / roasters Price certainty, margin protection Requires expertise, capital requirements
Options Strategies Mid-size businesses Flexibility, defined maximum cost Premium costs, complexity
Fixed-price Contracts Small roasters Simplicity, predictable budgeting Limited to available supply, potential missed opportunities
Direct Trade Specialty roasters Quality control, supplier relationships Time investment, limited scale
Conclusion: Preparing for the Future of Coffee Prices
Coffee markets have entered a new era of extreme volatility rather than a smooth moderation: after setting a record above $4.37/lb in October 2025, Arabica swung to a 2026 low near $2.39/lb in June, spiked to the mid-$3/lb range by July partly on a new U.S. tariff on Brazilian imports, spiked again to $3.42/lb in August on a 26-year low in ICE certified stocks, and settled near $3.08/lb by September 1. Prices remain well above 2020-2023 norms even after the pullback. Businesses investing in supply chain resilience, diversification, and sophisticated hedging will be better positioned to manage this volatility than to rely on any single point forecast.
Key Recommendations:
Implement comprehensive hedging programs covering at least 50% of annual volume.
Diversify supply sources across multiple origins and both Arabica and Robusta varieties.
Build direct relationships with producers to improve supply visibility and quality control.
Monitor climate forecasts and adjust procurement strategies quickly.
Invest in inventory management systems balancing carrying costs against supply security.
Consider long-term contracts with trusted suppliers to stabilize costs.
Stay informed on production forecasts from USDA, ICO, and major analytical firms.